Overview
The donut and the PASS / FAIL / SKIP / XPASS / XFAIL / ERROR counts, with the time the run took beside them.
One command writes one HTML file. Inside it are a dashboard, a searchable metrics table, pictures of what broke, the payloads a test attached, the steps it ran, its coverage, and an analytics tab read across every build you have kept. This page is the full list — what each part shows, what it costs, and where the detail lives.
The output is one static HTML file. There is no server to run, no asset folder that has to travel with it, and no build step: you can mail it, publish it as a CI artifact, or open it off a stick. Everything below lives inside that one file.
$ pip3 install pytest-html-reporter
$ pytest tests/., so a plain run writes ./pytest_html_report.html. Pass --html-report to move it, with strftime placeholders if you want a folder or a filename per run.
--title sets the heading, capped at 20 characters with the cut tail faded out and the full title kept as the heading's tooltip. --environment puts a badge beside it, capped at 10 characters the same way.
Archives costs roughly 5KB of the page. Retention is what keeps a long-running job's report quick to open.
pytest.iniEvery flag but --title has an ini key, so a setting that belongs to the job rather than to one command can be written down once. See Configuration.
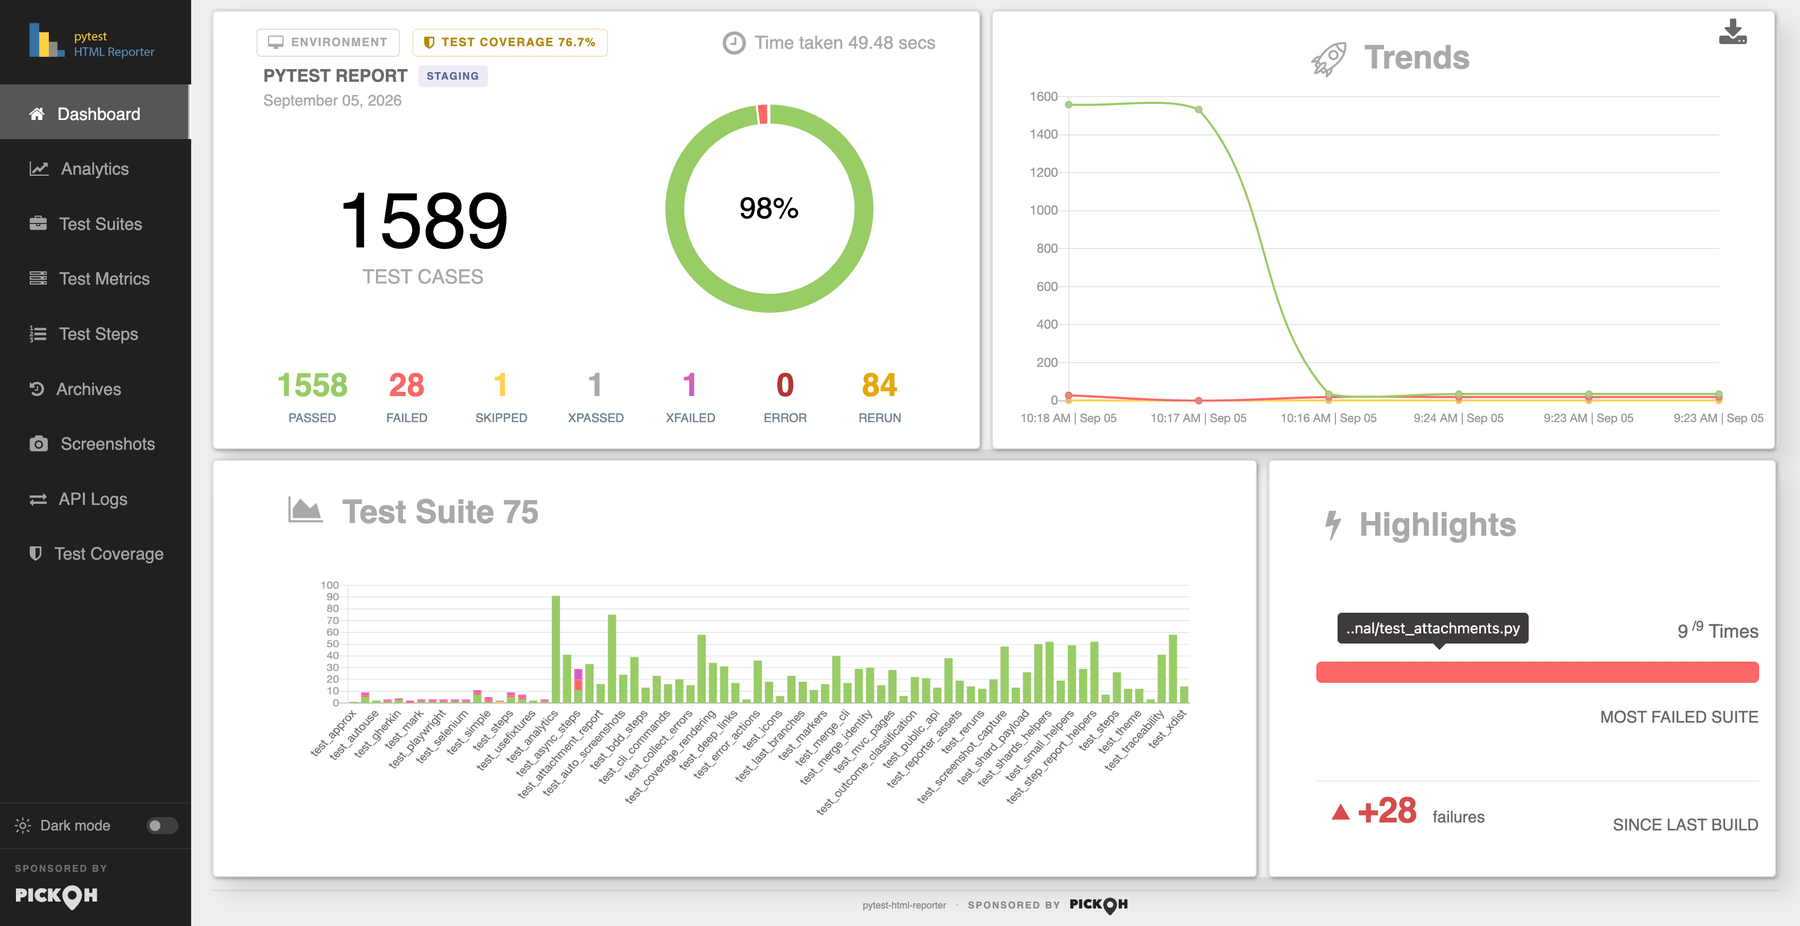
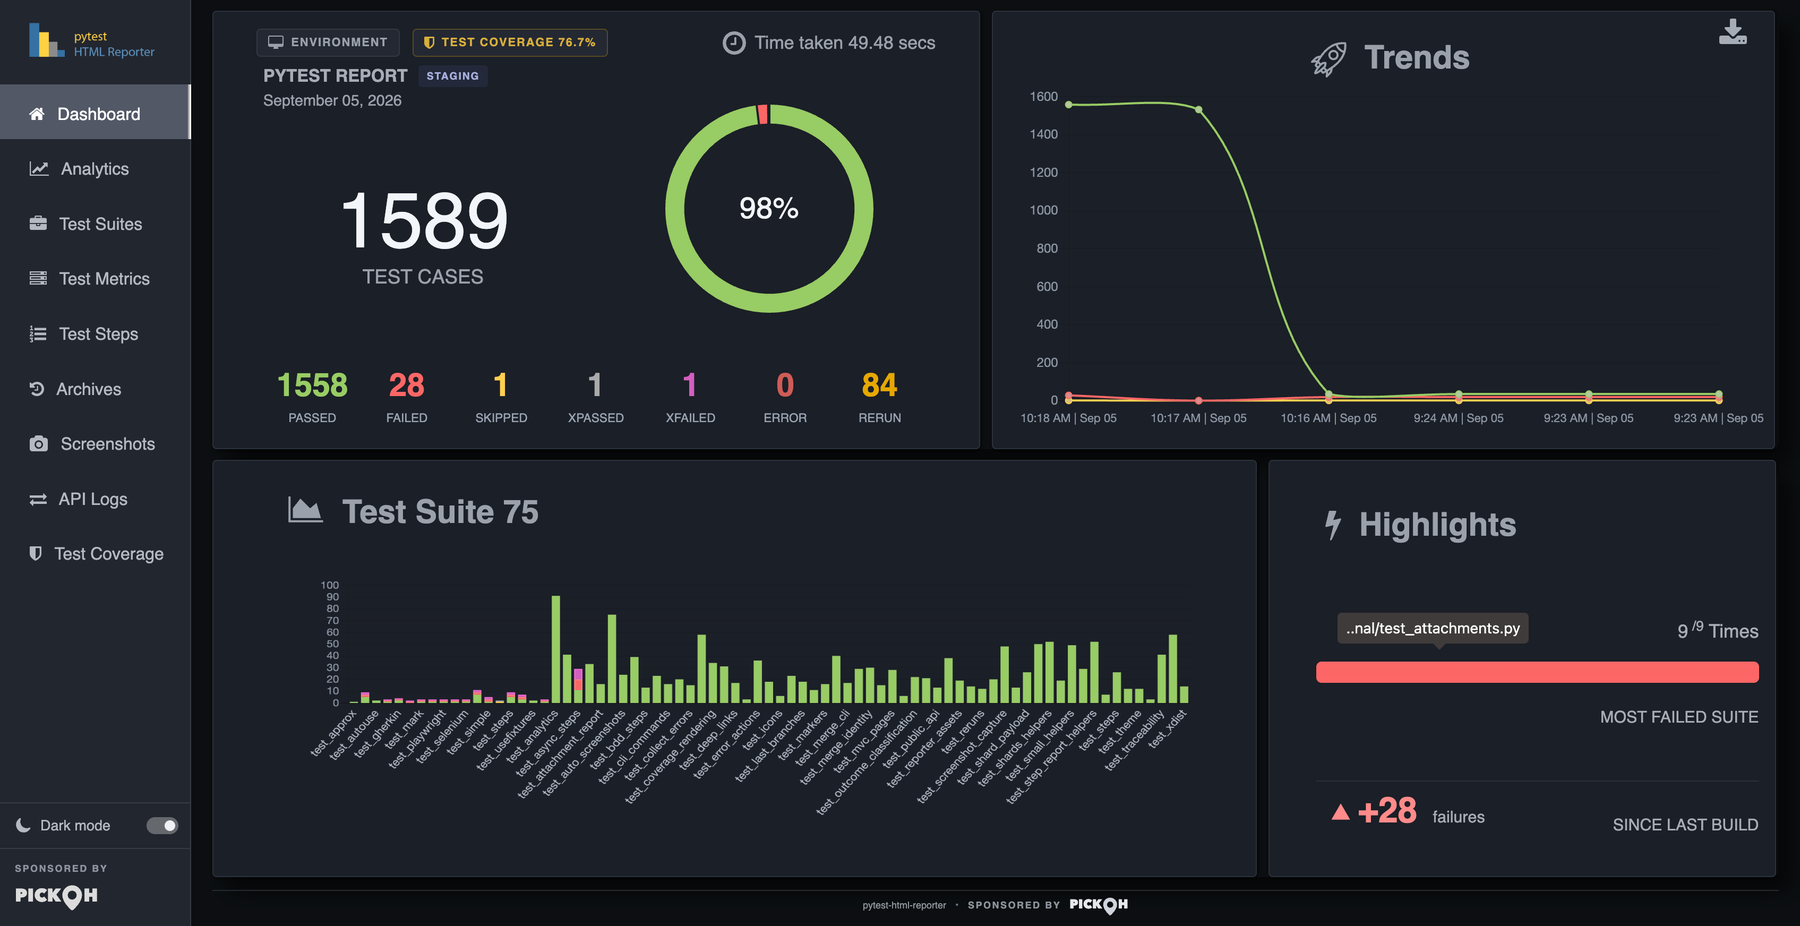
A switch at the foot of the side nav. It is remembered per reader, and follows the operating system until somebody touches it. There is no flag and no ini key for it — the theme belongs to whoever opens the report, not to the run that produced it.
When the run finishes, the report opens in your browser. Nothing has to be added to get this.
It only happens on a run somebody is sat in front of, and a build agent fails every one of the
three checks: the output has to be a terminal, no CI variable may be set (CI,
GITHUB_ACTIONS, JENKINS_URL and the rest of the usual set), and on
anything that is not macOS or Windows there has to be a DISPLAY or
WAYLAND_DISPLAY to open into.
$ pytest tests/ --report-open=none      # never open it
$ pytest tests/ --report-open=always    # open it whatever the run looks like
$ pytest tests/ --report-open=auto # the default, as described above[pytest]
report_open = noneThe browser is asked for a tab rather than a window, so a suite run over and over does not bury the desktop. A machine with no browser on it is not an error: the report is written either way, and a run that could not open it still passes or fails on its tests alone.
--report-link adds an entry to the report's side nav pointing at any page you like
— the annotated coverage source, a CI job, a Grafana board, an internal wiki page. Repeat it as
often as you need. Relative paths are resolved from wherever the report is written, so linking a
folder that ships beside it works, and links open in a new tab.
$ pytest tests/ --report-link "Coverage=htmlcov/index.html" \
--report-link "CI job=https://ci.example.com/job/42"http, https or mailto is dropped rather than rendered. A
report is a build artifact that gets published and passed round, and a nav entry has no business
being able to run something in whoever opens it.The Dashboard answers how did this run go? — the counts, the shape of the
failures, and whether the suite is moving in the right direction.
The donut and the PASS / FAIL / SKIP / XPASS / XFAIL / ERROR counts, with the time the run took beside them.
Passed, failed and skipped plotted across this run and the five builds before it.
Failed here counts failures and errors together.
The suite that failed most, and — once a second build exists — which way the failure count has moved since the last one.
Every suite in the run with its own counts, so a failure concentrated in one file is visible without opening the table.
What the run was, where it ran, which pipeline and commit it came from, and what it kept of the output — opened from a chip on the summary card. Most of it needs no flag.
The table is a DataTable: search, sort, and export buttons for copy, CSV, Excel, print and
column visibility. It already carries ten columns, which is why markers ended up as badges on
the Test Steps tab rather than as an eleventh.
| Column | What it holds |
|---|---|
Logs | How many lines of captured output the test produced. Clicking it opens the output section by section, with a Copy button. A test that produced nothing shows a dash. |
Data | How many payloads the test attached. Clicking it crosses to the API Logs tab with the list already narrowed to that one test. |
Screens | A thumbnail of the screenshot taken for that test, next to the error it explains, opening full size when clicked. |
Steps | Crosses to the test's step tree on the Test Steps tab. |
Rerun | How many attempts the test took. From 0.4.2 a non-zero count is a button, opening the trail of what each attempt did. A test that ran once shows a plain, disabled 0. |
Error Message | The failure, truncated in the cell and expandable in place, with the copy buttons beside it. |
--environment names what was under test and shows it as a badge beside the report
title. --build-info takes any key=value you like and adds it to the
Environment panel; repeat it as often as you want. Unlike most of the flags,
--build-info entries are added to the ones set in the ini file rather than
replacing them.
$ pytest tests/ --environment=prod --build-info branch=main --build-info sha=$GITHUB_SHAThe same panel states what the run kept of the output and from which log level — for example
all tests: stdout, stderr and logging, logging from WARNING — so there is always
somewhere to check which mode you are in.
-n — how many xdist workers reported results. Nothing you
have already named through --build-info is overruled. See
CI integrations.A run built with a named profile gets one more row, Profile,
saying which one — so the panel answers "where did the logs go" as well as "where did
this run happen". New in 0.4.3.
One row is opt-in: --report-packages adds
a Packages row listing every installed distribution and its version, the way
pip freeze reads. It is off by default because it is a few hundred entries nobody reads until
the day the report is the only surviving record of what was installed — and it publishes a full
dependency inventory into a file that gets passed around.
Once there is a build to compare against, the Highlights card gains a second entry
saying which way the suite is moving: ▲ +3 failures over SINCE LAST BUILD,
red when there are more failures than last time and green with a ▼ when there are
fewer. Nothing to configure — it appears as soon as a second build has been archived.
The absolute count tells you how bad this build is; the delta tells you whether it is getting
better, which is the one you act on. Hovering it gives the two counts behind it —
12 failures this build, 9 in the build before it — because +3 reads very
differently against 3 than against 300. No change is written ±0 failures rather than
0 failures, which beside SINCE LAST BUILD would say the opposite of what
it means, and a first build leaves the entry out entirely rather than comparing against a build
that does not exist.
A status column tells you a test failed. Everything in this section exists to shorten the distance between seeing that and doing something about it.
Four buttons sit beside a failure message, folded behind a ... until pressed:
Logs column uses,
which gives the dialog a Copy button and a readable body.pytest path/to/test.py::test_name, built from
the test's node id rather than by joining the suite and test names in the row, because a test
inside a class is listed under its own name where pytest wants the class in front of it.$ pytest "tests/test_cart.py::TestCart::test_add[sku-A-12]"A node id a shell would not read as one word is quoted, since a parametrised test's brackets are a glob pattern to zsh.
A click also puts a word in the middle of the page — Error copied,
Command copied, Link copied — faded in and gone 2.2 seconds later,
because 22 pixels of button at the end of a long row is not legible from wherever the pointer is,
and because it says which of the three landed. It takes no clicks, so the row underneath
stays live while it is up, and it shows four lines of what went onto the clipboard with anything
past that faded out. Only one row is open at a time; a click anywhere else, or Escape, shuts it.
file:// page. When that happens the panel says
Press Ctrl+C to copy rather than leaving a button that did nothing and no reason
why.... to unfold the four buttons, clicking Copy link, and the words "Link copied" fading in mid-page with the four-line clipboard preview underneath, then fading out.
The PASS / FAIL / SKIP / XPASS / XFAIL / ERROR count pills over the Test Metrics table are clickable, and drive a column search on the table under them. One click gets you "show me only the failures", which is the most common thing anybody does with a report like this.
From 0.4.3 the seven figures under the Dashboard's ring are the other end of the same filter.
Each is a button that opens Test Metrics with the table already filtered to what it counted —
Rerun to every test that ran more than once, since rerun is a count rather than an
outcome — and a counter standing at zero is disabled rather than offering rows that are not there.
The filter is in the address as #test-metrics?status=FAIL, so "the failures in last
night's build" is a link somebody can be sent, and a Clear filter control stands
beside the chips for the reader who arrived on one.
A cut error message ends by fading its last eight characters out rather than in an ellipsis — the same answer the report title gives to the same question. The ellipsis is still in the cell, hidden: the CSV, Excel and print exports are built from cell text, they cannot carry a gradient, and a message cut short with nothing to say so is a trap in a file read a week later.
Every test row has an address of its own, copied from a button beside the failure, opening the report on that row whatever page of the table it has ended up on. Three decisions make the link worth sending:
test_one[a-b] and test_one[a_b] apart when the slug cuts to the same
string.
A node id that appears twice — pytest-repeat, or a rerun collected rather than
merged — has its repeats numbered, so the two rows keep separate addresses.
One run cannot tell you whether a failure is new, whether a test has been flipping for a
fortnight, or whether the suite is quietly getting slower. The Analytics tab reads
every build you have kept and lines them up per test. Nothing to install, nothing to configure,
and nothing extra is collected: the archives already hold a status per test per build.
One number, 0–100. It starts at the mean per-test pass rate and is charged half the mean flip rate, because a test that alternates pass, fail, pass is the more expensive of the two to live with.
Tests that have flipped between passing and failing, or that needed a retry to pass — kept apart from the ones that have never passed.
Tests that have failed every build they were in, two builds running or more. A test that only ever fails is a bug with an owner, not a race worth hunting.
This run's failures grouped by the exception each came out of — 12 failures, 9 are TimeoutException — with the tests in each group named rather than only counted.
One row per owner, worst first: the tests they hold, the share of the suite that
is, their mean pass rate, what is failing now, what is flaky and where their minutes go. Forty
failures over six teams and forty in one team read identically everywhere else.
One row per severity level in ladder order, Unrated last, led by what
somebody came to the tab to find out — 1 critical test failing. Forty failures at
trivial and two at blocker are not the same run.
The drift, on an axis that is deliberately not pinned to 0–100: a suite that lives between 96% and 99% is exactly the one whose two-point drops matter.
This run's tests bucketed by duration, which a slowest-tests list cannot tell you: two thousand tests at 300ms each is a different problem from ten tests at a minute.
Under the figures, four cards name what changed since the previous build — newly failing, newly fixed, new tests and no longer run — each opening its full list in a searchable dialog. Then a sortable row per test: its verdict, its recent outcomes as a strip of one block per build, its pass rate, how many times it has flipped, its retries, how long its current streak has run and its duration. It opens worst-behaved first, so the list to work through is already the list on screen.
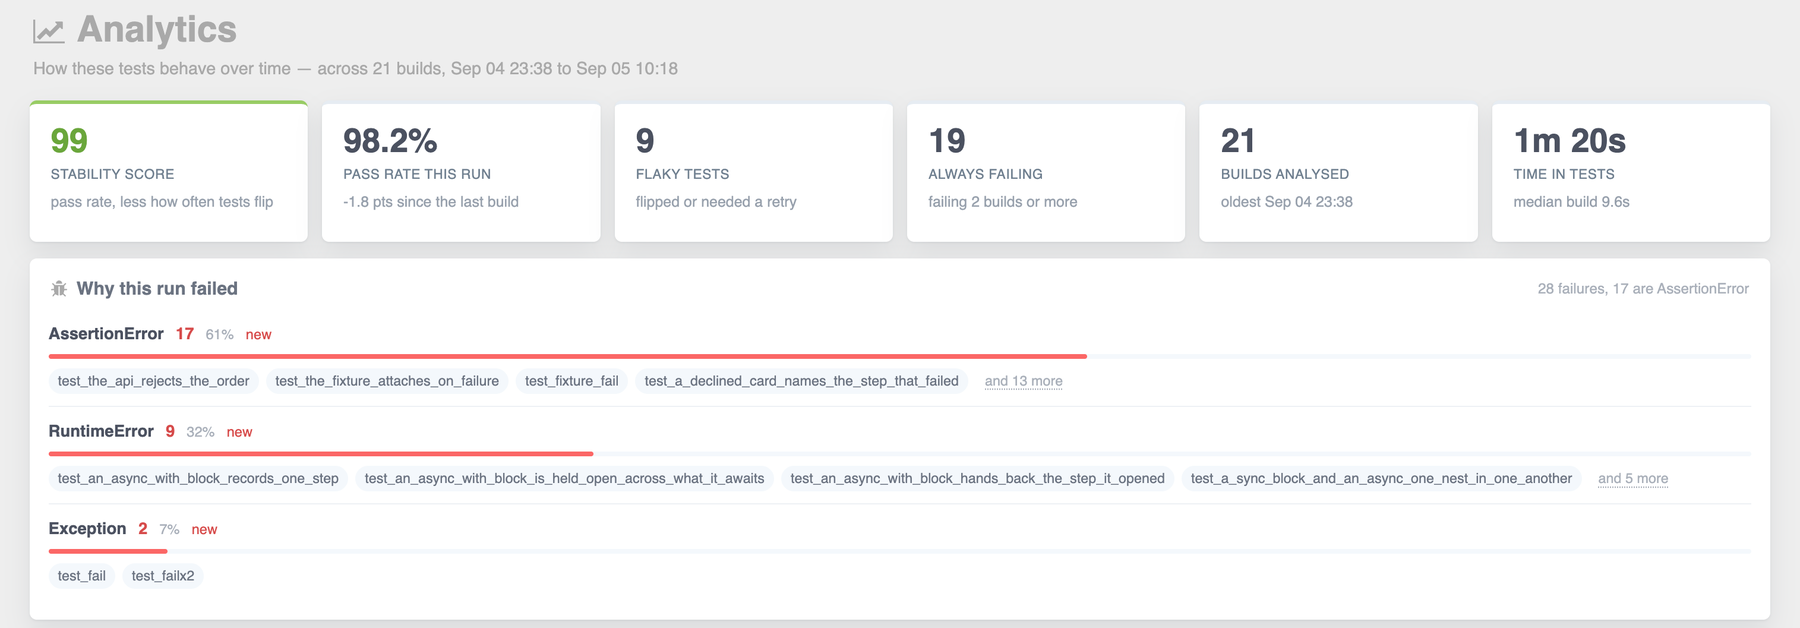
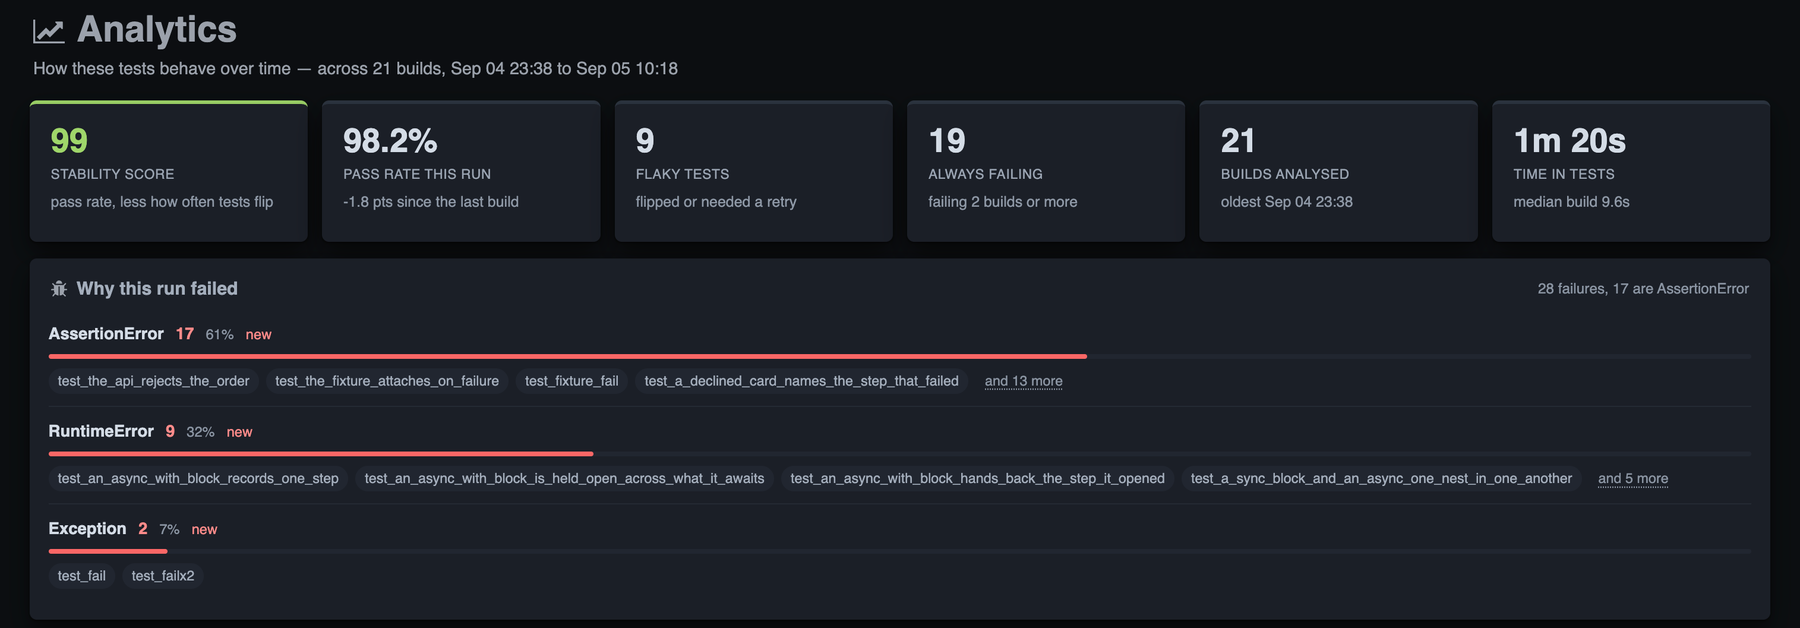
xfail / xpass count as passes —
they are outcomes the suite declared in advance. How far back the tab reads is whatever
--archive-count, --archive-days and --archive-since have
kept; the charts draw the most recent twenty builds so the axis stays readable, while the tables
count every build on disk.Analytics in full — every figure, every panel, and what the tab shows on a first run.
A status column tells you a test failed. Steps tell you where, and how long it had been
running when it got there. Name the pieces a test is made of and they are timed, nested, and shown
on a Test Steps tab of its own, with the suite drilling down to the test and the test
to what it did.
from pytest_html_reporter import step

def test_checkout():
    with step("Add to cart", sku="A-12"):
        cart.add("A-12")

    with step("Charge the card"):
        assert gateway.charge(cart).ok
The same function works as a decorator, which is how the methods of a page object or an API
client — already the steps of every test that calls them — get named once for all of those tests.
The arguments of the call fill in the {placeholders} of the title.
@step("Log in as {user}")
def login(user):
    page.fill("#user", user)
    page.click("#submit")

login("amy") # the tab shows: Log in as amy, with user=amy kept beside itstep() still gets a tree saying where its time
went. Naming steps makes that tree deeper; it does not bring it into existence.
Set up or Tear down
rather than swallowing the test that used it.
async test names steps the same wayNew in 0.4.1.
async with step("…"), and @step on an async def,
with nothing to install and no setting to turn on — pytest-asyncio,
anyio and trio are all driven the same way. Work run concurrently comes
back as the siblings it was rather than nested inside whichever leg happened to be open, and each
leg keeps its own children and its own attachments.
attach_api,
attach_json, attach_text and attach_file need no extra
argument to say which step they belong to, and the step shows a paperclip. A failing test's
screenshot is shown on the step that threw.
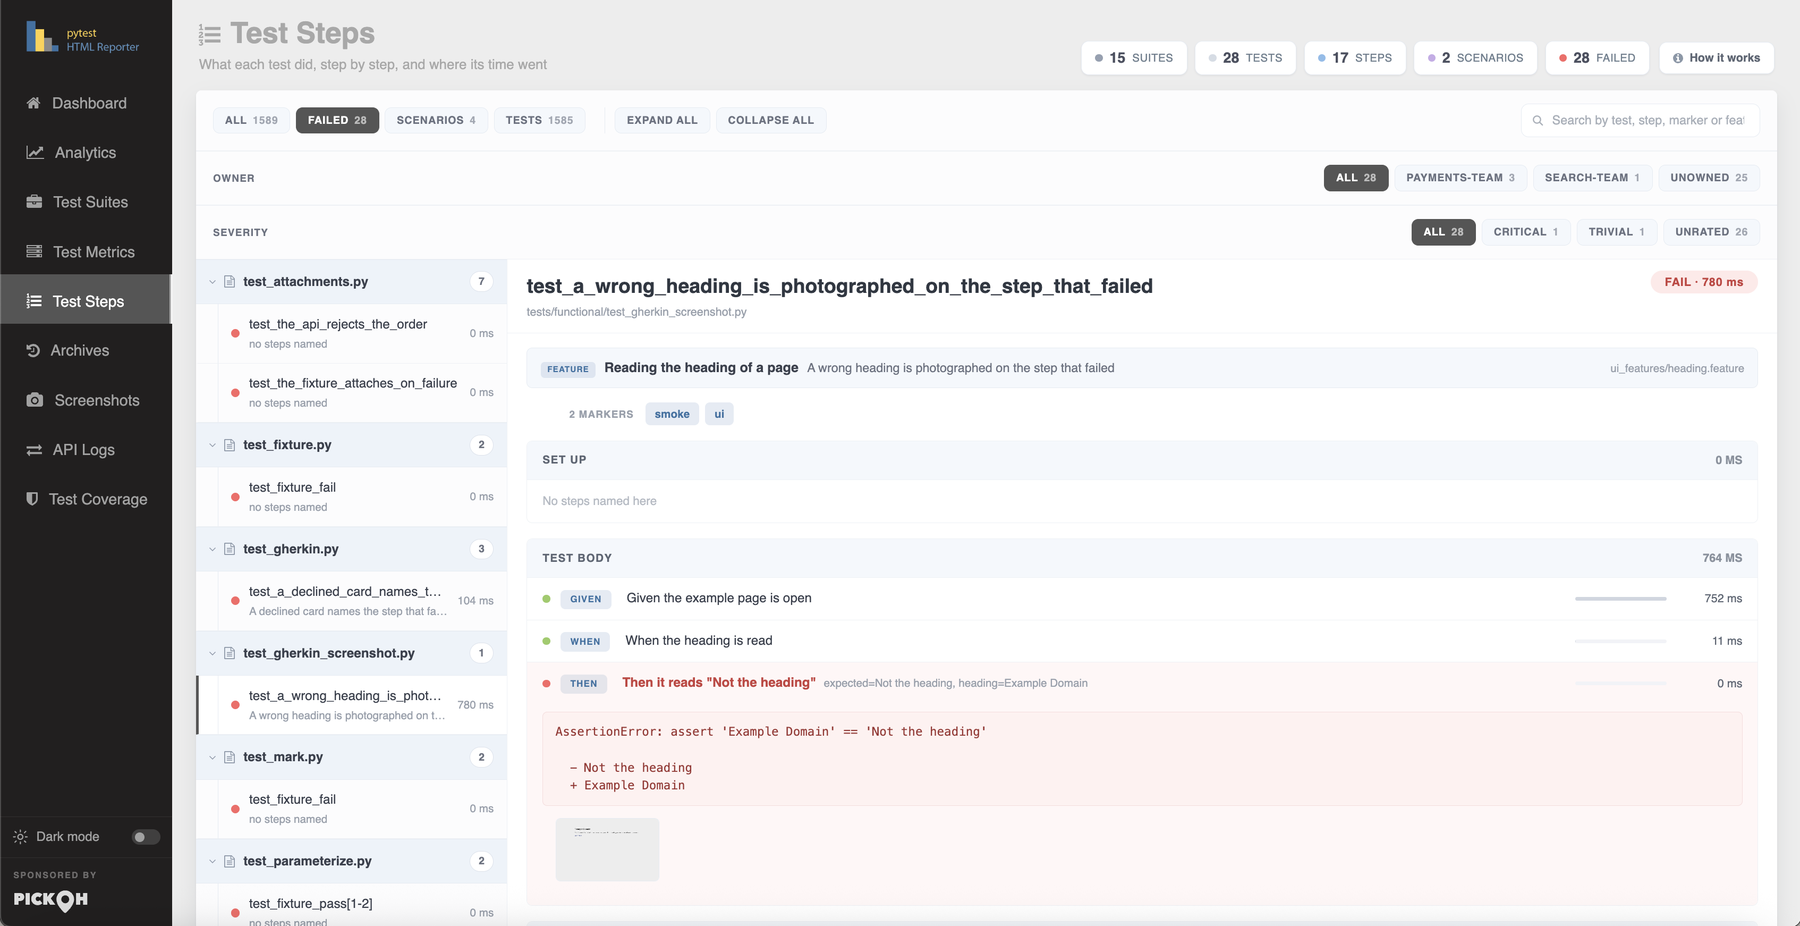
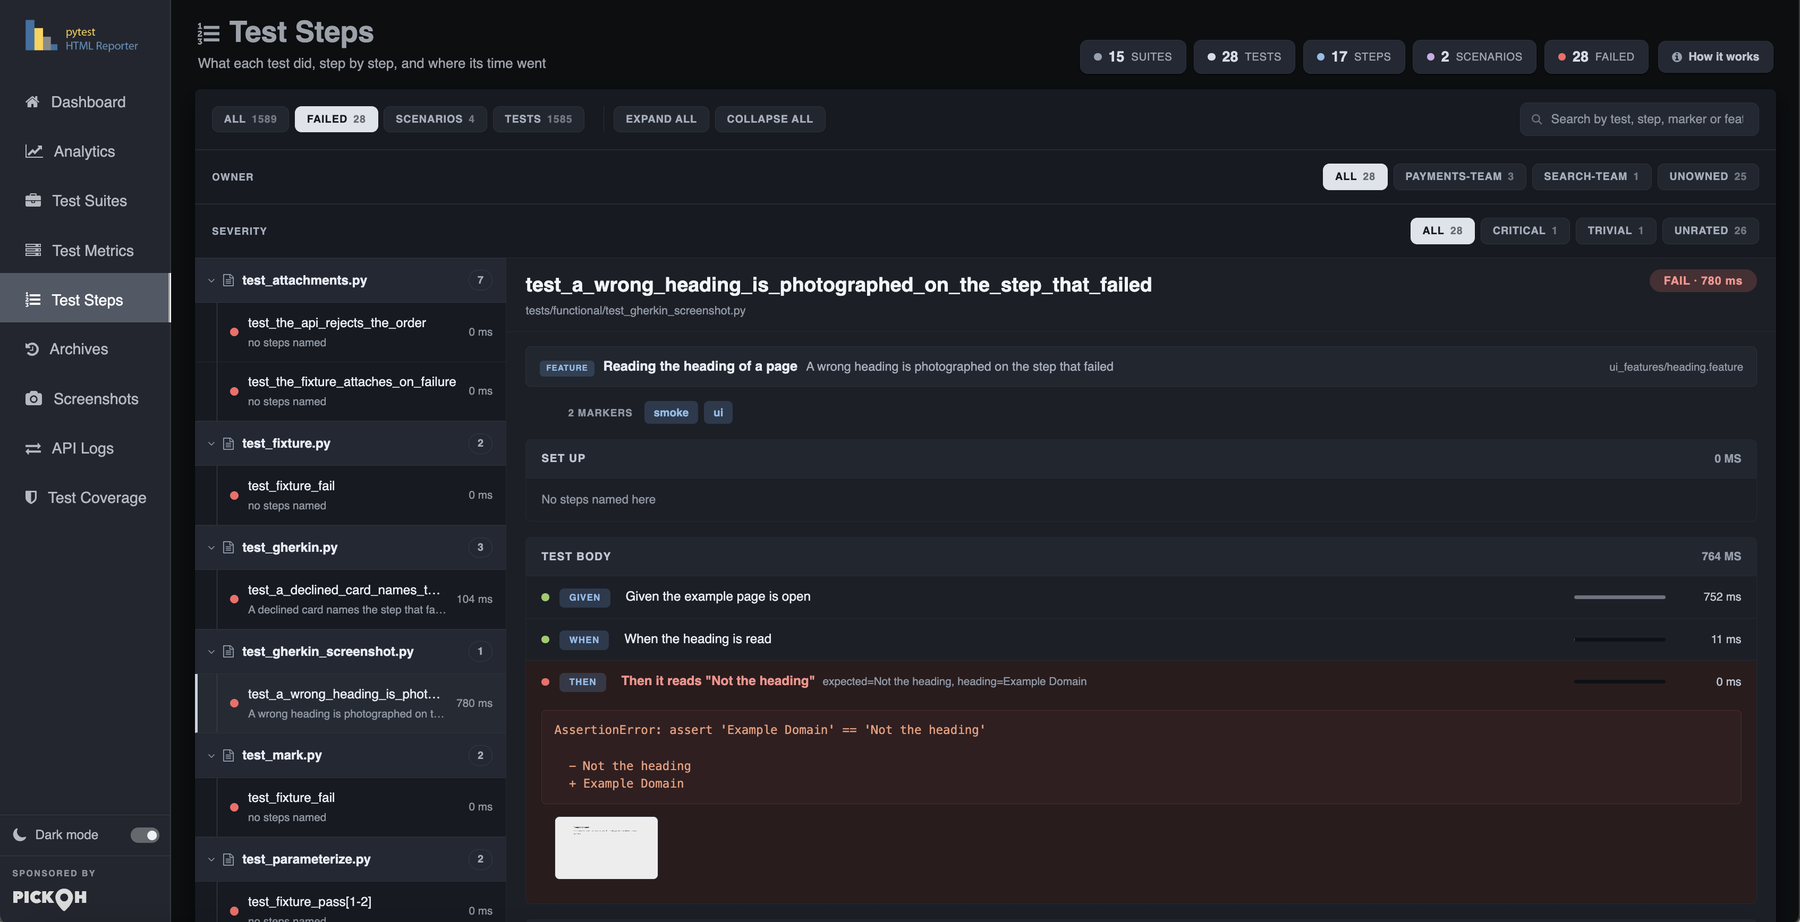
A pytest-bdd scenario is already a list of named steps, so its Given / When / Then
arrive on their own — each timed, each carrying what its parser pulled out of the line, and badged
as Gherkin so a specification never reads as somebody's plumbing. The feature, the scenario and the
feature file are named above the tree, an Outline's <placeholders> are shown
filled in with the row that actually ran, and the scenario's tags arrive as markers.
pytest-bdd does not have to be installed: the hooks are declared optional, so a run
without it is untouched.
Markers are shown in full, including the ones a test never mentions: a module-level
pytestmark, a marker on the class, one added by request.node.add_marker
while the test ran. Each says which scope it came from, which is the answer when nobody remembers
applying it. pytest's own markers are coloured apart from yours, because skipif
changes how a test runs and @smoke only names it. Two are cut down deliberately:
parametrize shows its argument names rather than every row the test will ever run
with, and a skipif condition — evaluated at import, so it reaches any reporter as a
bare False — is shown as its reason instead.
A marker holding an id is already collected and already shown, but as a flat badge — nothing in
the report knows that PROJ-123 is an issue rather than a word. A pattern is the missing
half. Name a marker in report_link_pattern, put {} where its argument goes,
and every test carrying it gets a badge that opens the ticket.
[pytest]
report_link_pattern =
    jira = https://acme.atlassian.net/browse/{}
    testcase = https://acme.testrail.io/index.php?/cases/view/{}
owner = https://github.com/orgs/acme/teams/{}@pytest.mark.owner("payments-team")
@pytest.mark.severity("blocker")
@pytest.mark.jira("PROJ-123")
@pytest.mark.jira("PROJ-987") # two tickets, two badges, one row
def test_refund_is_idempotent():
...PROJ-123. A test that closes two tickets gets two badges in one
row.
owner answers who do I tellIt gets a row of its own ahead of
the tags rather than sitting among smoke and slow, and it is a filter:
once anything carries one, the Test Steps rail grows a row of per-team pills, counted, busiest
first, with an Unowned pill at the end.
severity is a ladder, not a tagAllure's five words, worst first —
blocker, critical, normal, minor,
trivial. One test, one level: the nearest marker wins, two at the same scope are
read as the worse of them, and the overridden one is still shown struck through with a tooltip
saying where each was written. A test nobody rated is unrated, not
normal.
<property> elements on the
testcase, which is the half Xray, Zephyr and TestRail actually read — none of them opens an html
report. The property name is the marker name, so a suite that must emit test_key
writes @pytest.mark.test_key and gets exactly that. Only owner,
severity and the markers you named are written, so nothing starts appearing in a
file your CI parses without having been asked for.
--strict-markers accepts
them and no run prints PytestUnknownMarkWarning for a marker this plugin asked you to
write. The pattern markers are registered from your configuration, because which names mean
something is your decision.
Test steps, Gherkin and markers in full — including
--report-steps, --report-step-limit, and what a retry reports.
Three different kinds of "what actually happened", each kept against the test that produced it.
A test that fails while holding a Selenium driver or a Playwright page is photographed. No hook
to write, no fixture to add, nothing to import. The picture is taken at the very end of the test,
before the fixture that quits the browser has run. What makes something a browser is that it can
hand over a PNG, so Selenium, Playwright, appium, splinter and a driver wrapper of your own are all
covered, whatever the fixture is called — page, driver,
browser, selenium or anything else. A test driving two browsers at once
gets a picture of each.
def test_checkout(page):
    page.goto("/cart")
    assert page.locator("h1").inner_text() == "Cart"     # fails, and is photographed
Every screenshot lands in two places: the Screenshots gallery, and the
Screens column of the row it belongs to. --report-screenshots decides
which tests are photographed — failed by default, all if a screenshot of
a pass is a baseline worth having, none to switch it off. When the moment matters,
attach takes the PNG bytes yourself, from anything that can produce one; an image you
attached is always kept whatever that flag says, and a test that attaches its own is not
photographed again on the way out.
A picture is no use when the thing under test is an API. attach_text,
attach_json, attach_api and attach_file take the payloads
instead, and everything a test hands over is opened from the API Logs tab.
from pytest_html_reporter import attach_api, attach_file, attach_json, attach_text

attach_api(requests.get(url))                         # the whole call
attach_json({"expected": order, "got": response})     # pretty-printed, secrets blanked
attach_text(query, name="Query", format="sql")        # any text at all
attach_file("payloads/order.json") # a small file from diskAuthorization, Cookie,
Set-Cookie and any name containing token, secret,
password, api-key or x-auth become
<redacted> — in the headers, in the curl command, in a JSON body at any
depth, and in a query string. A report is a build artifact; it gets published.
redact=False opts out.
requests and httpx both work out of the box — and so does
the async one. Every field can also be given directly, and an explicit one always wins over the
response object.
pytest-rerunfailures that attaches nothing on the attempt which finally passed
keeps what the failing attempt attached, rather than losing the evidence by succeeding.
Everything pytest captures while a test runs — from setup, call and teardown alike — is kept
against that test, and this is on by default. The Logs column shows how many lines a
test produced; clicking it opens the output section by section with a Copy
button.
| What the test does | Where it shows up |
|---|---|
print(...) | Captured stdout section |
sys.stderr.write(...) | Captured stderr section |
log.info(...), log.warning(...) | Captured log section, subject to --log-level |
| an assertion failure or traceback | not here — the Error Message column already has it |
warnings.warn(...) | not here — pytest keeps its own warnings summary |
So a test that only asserts has nothing to show and correctly gets a dash, even when it fails.
Two of pytest's own options decide what reaches the column at all: -s (that is,
--capture=no) sends stdout and stderr straight to the terminal so nothing is captured,
and logging is captured from WARNING up unless --log-level
lowers it.
-s for the live
output, --capture=tee-sys gives you both: it streams to the terminal and still keeps
the output for the report.Screenshots in full covers the automatic capture, the async and
unittest cases, and taking the picture yourself.
The Python API documents all six functions —
attach, attach_text, attach_json, attach_api,
attach_file and step — with every argument each one takes.
Run with pytest-cov and the report grows a Test Coverage tab: the
overall percentage as a ring, the counts beside it, a row per file with its missing lines, and the
percentage plotted across this run and the five builds before it. A chip on the
Dashboard shows the figure and crosses to the tab. Nothing needs configuring — if coverage was measured, it is
there.
$ pytest tests/ --cov=my_package --html-report=./report
$ pytest tests/ --cov=my_package --cov-branch --html-report=./report--cov-branch on, branch coverage is folded in exactly
as pytest-cov folds it in and the table gains a Branches column;
without it, that column is dropped rather than filled with zeroes.
--cov-fail-under has stated a line, in which case that is where the
colour is drawn and the tab says so. A report should not disagree with the build that just
passed or failed beside it.
--report-coverage-limit sets how many files are
listed.
output.json
beside the test counts, which is what gives the tab its +0.8 since the last build
and its trend line. A build that ran without coverage leaves a gap in that line rather than a
drop to zero.
The tab does not need pytest-cov to have run in this session — useful in CI, where
coverage is often produced by an earlier step. The kind of file is worked out from its contents,
not its name, and a coverage.json or Cobertura coverage.xml sitting
beside the report or at the project root is found without being named at all.
$ pytest tests/ --report-coverage-file=coverage.xml     # Cobertura, from `coverage xml`
$ pytest tests/ --report-coverage-file=coverage.json    # from `coverage json`
$ pytest tests/ --report-coverage-file=.coverage # coverage.py's own data file.coverage data file is not
picked up automatically — one is usually left over from an earlier run, and quietly publishing a
number from last Tuesday is worse than publishing none. Name it if you want it. Reading a Cobertura
coverage.xml needs no coverage package installed at all, which makes it
the useful one when the reporting job is not the job that ran the tests.The annotated source is linked, never embedded: generate htmlcov/ with
--cov-report=html and the tab links to it, and only when that folder was written by
this run. Framing it into the page would break the one property the whole reporter is built on —
one file you can mail — and it would break silently, showing an empty frame wherever the folder did
not travel with it.
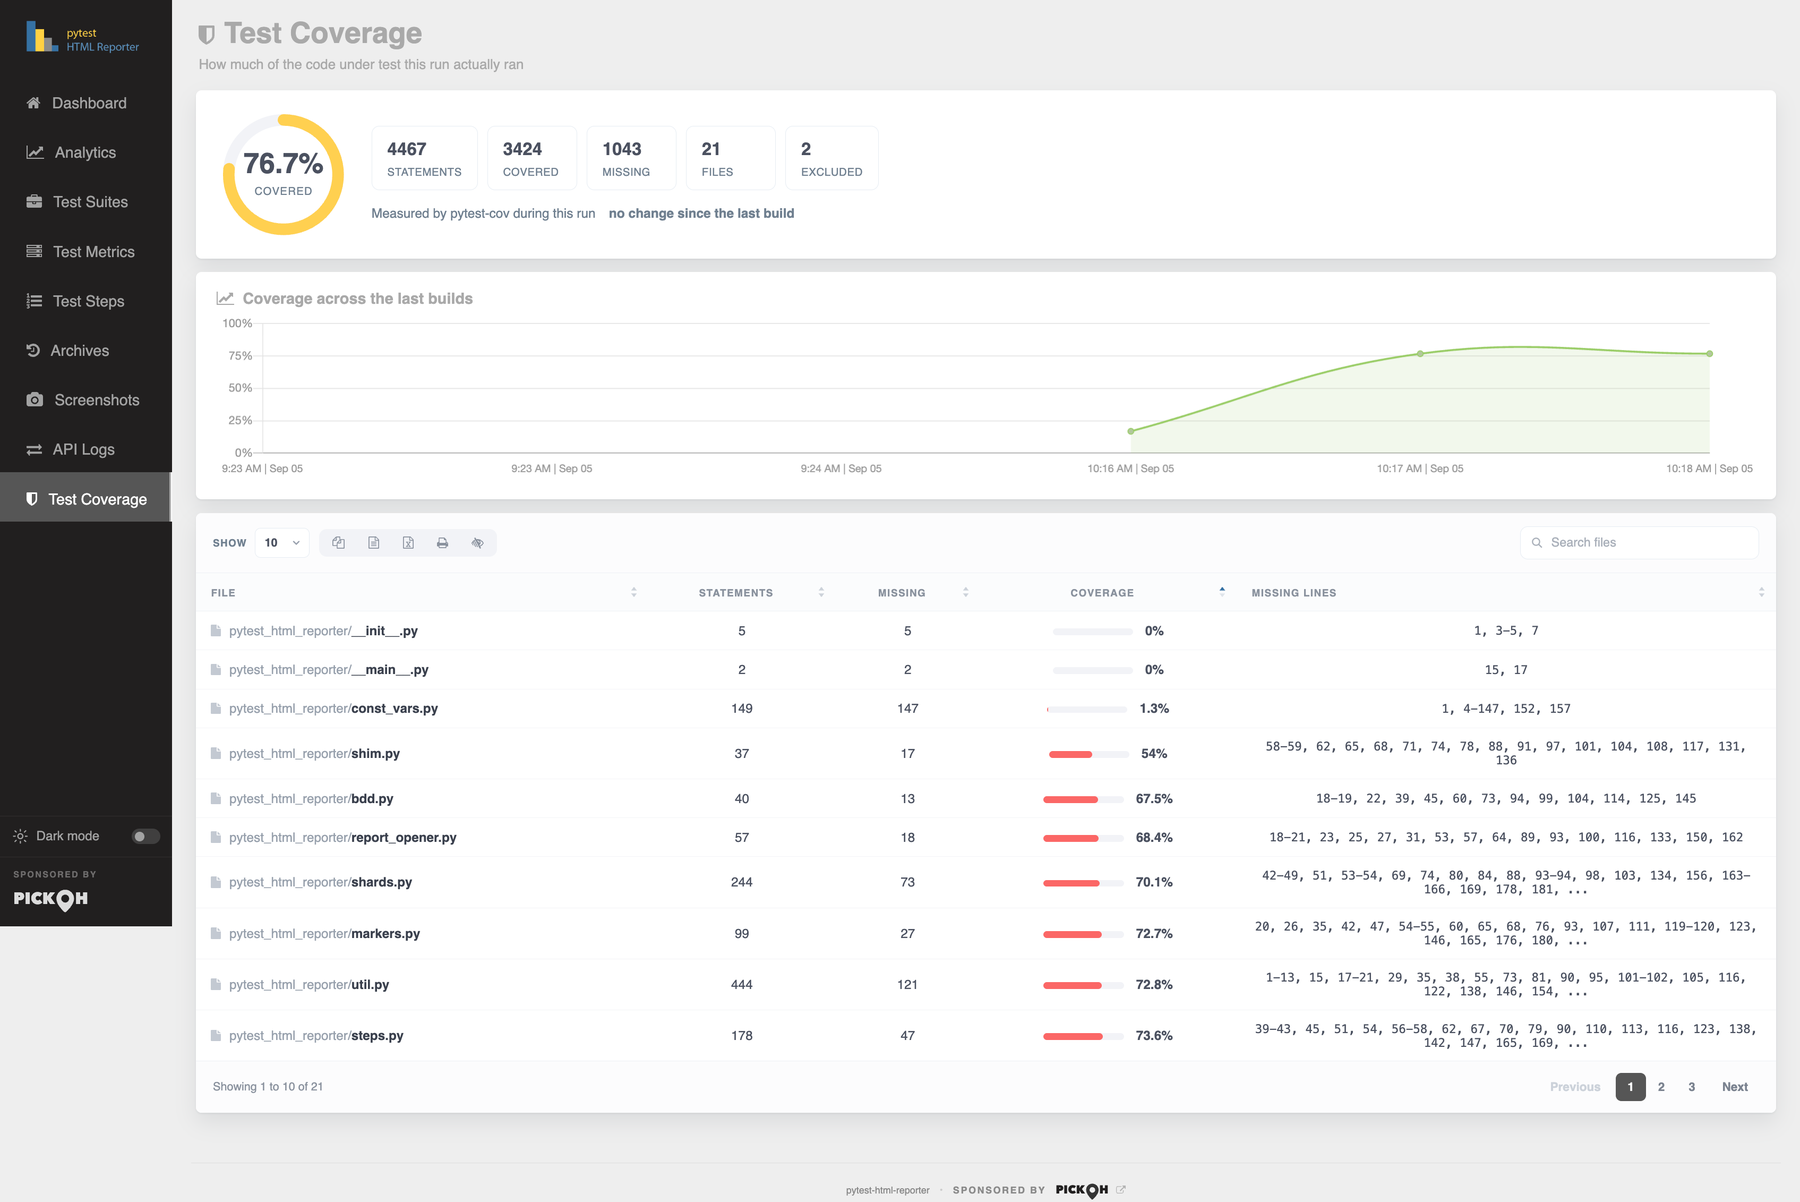
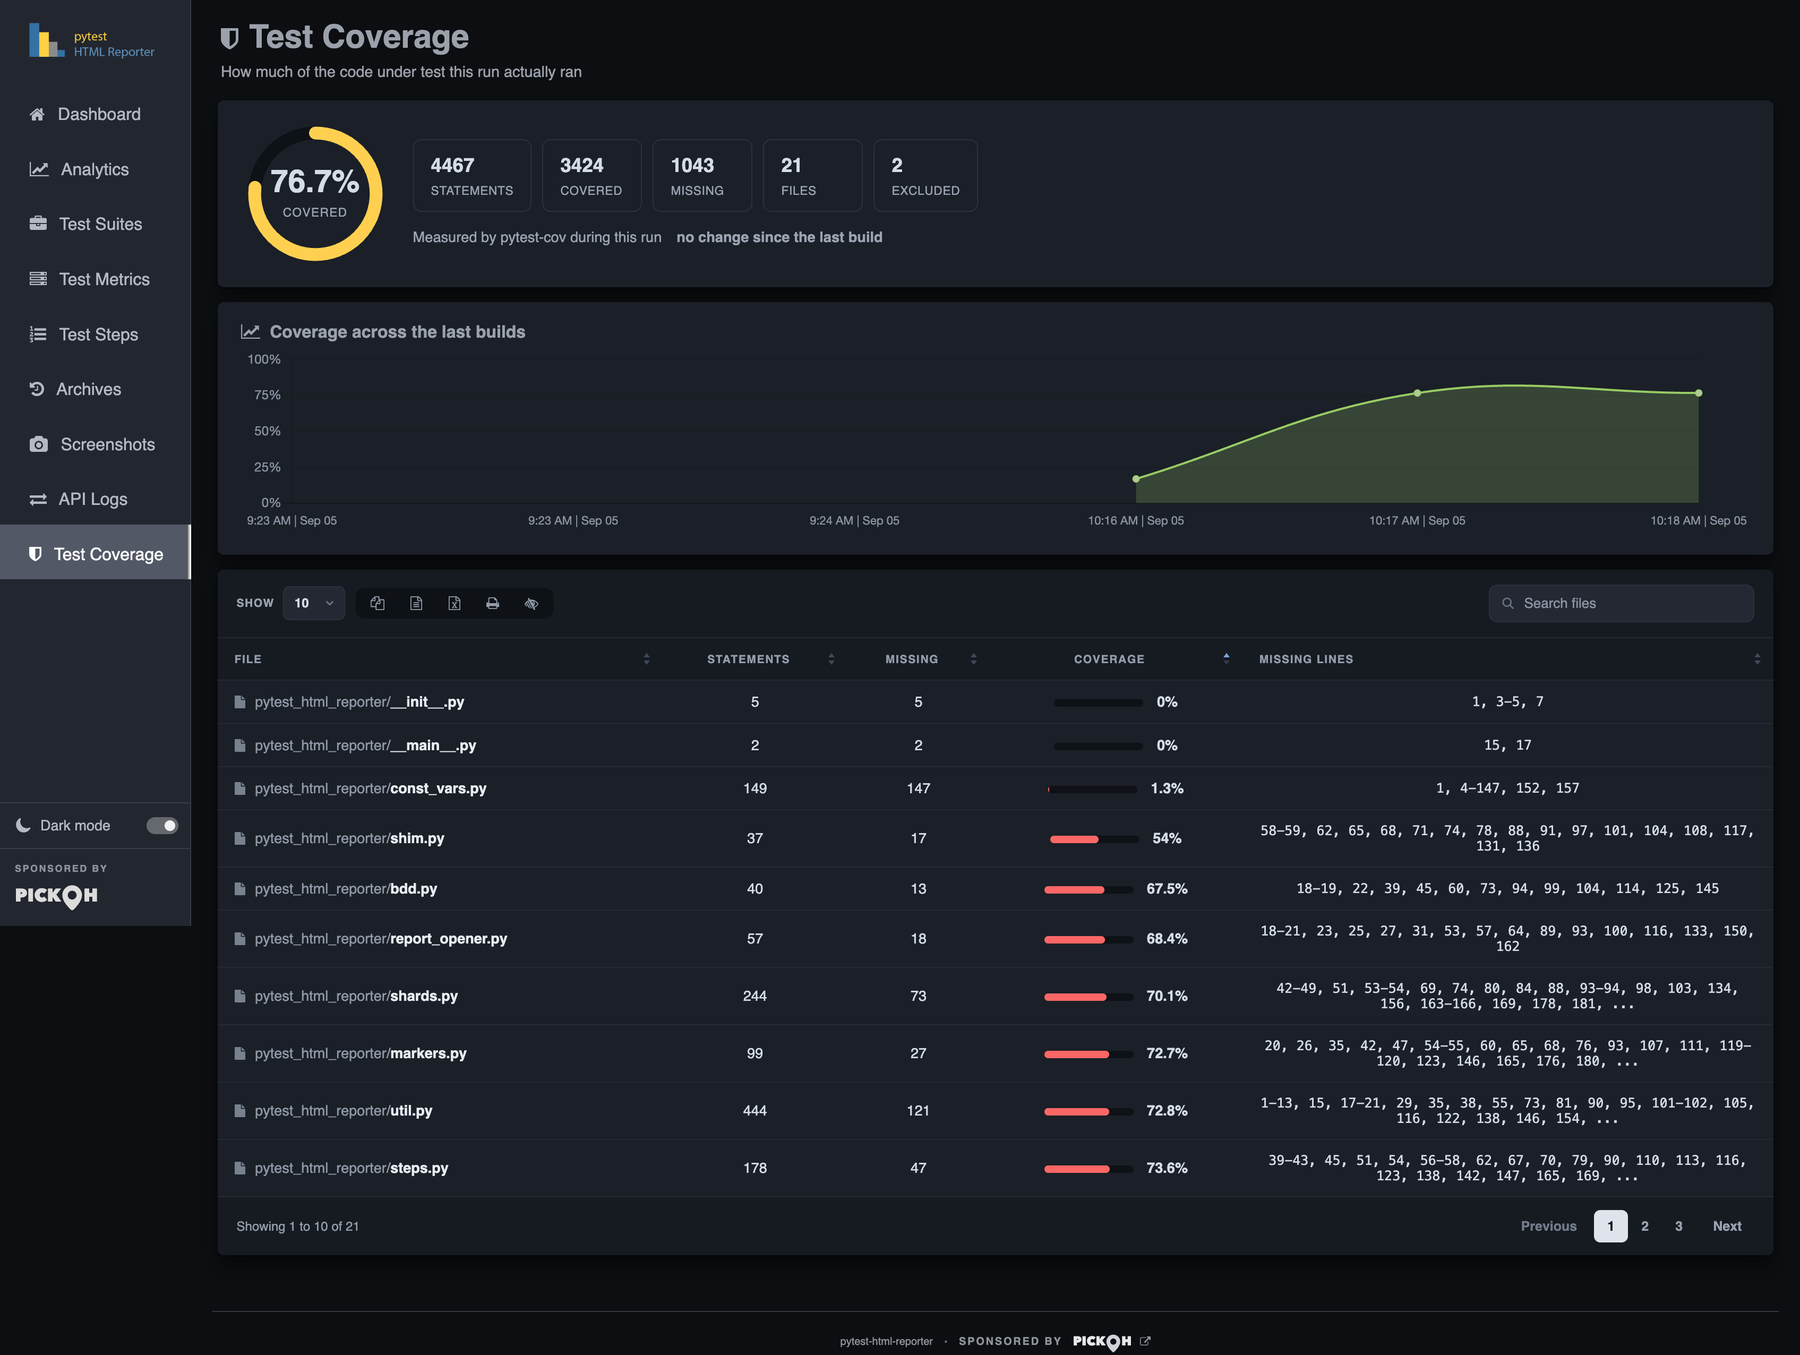
--cov — the ring, the trend and the per-file table with its missing lines.Every run archives its own record, and the Archives section lists them. That file
is what Trends, Highlights, the failure delta, the coverage trend and the whole Analytics tab are
built from: it holds the test counts, a status and a duration per test, and the coverage
percentage.
A build is dated by the moment its run started, which is kept in the name of its archive file — not by the file's mtime, which in CI is the moment of the checkout. That is what lets an age limit still measure the right thing after the reports have been copied into a fresh workspace.
$ pytest tests/ --archive-count 7                  # keep the last N builds
$ pytest tests/ --archive-days 30                  # a rolling window; fractions allowed
$ pytest tests/ --archive-since '2026-06-01 09:00'  # a one-off cut
The three intersect: a build has to satisfy every limit you set to be kept. Set none of them and every build is kept for ever, which is what eventually makes a report slow to open — a retained build costs roughly 5KB of the page, so an hourly run reaches a multi-megabyte report inside a couple of months. How far back Analytics reads is whatever these three have kept.
archive_count, archive_days or archive_since once and every
invocation, however it is started, keeps the same window.local, ci — and selected in one word.On a laptop you want the browser to open, every log kept and a handful of builds archived. On CI you want no browser, logs only where something failed, a JUnit xml beside the report and a month of history. Kept as two long invocations — one in a Makefile target, one in a workflow file — they drift the moment either is edited, and the drift stays invisible until somebody reads a report missing the thing they went looking for.
[tool.pytest-html-reporter.profiles.local]
open = "auto"
logs = "all"
archive_count = 10

[tool.pytest-html-reporter.profiles.ci]
open = "none"
logs = "failed"
junit = "report/junit.xml"
archive_days = 30$ pytest tests/ --report-profile=ciBoth files are read, so a repository that keeps a pytest.ini does not have to grow a
pyproject.toml to say ci in a single word. A profile can be pinned as the
default, so a bare pytest is already the shape the repository agreed on; a
PYTEST_HTML_REPORTER_* variable overrides one setting for one job without editing a file
everybody else reads; and a flag typed on the command line still beats all of it.
logs = "fail" is a typo rather than a
setting. It stops the run at configure time with one line naming the file, before a test is collected
— instead of falling through to all and keeping every log because six letters were
typed instead of seven.
Environment panel carries a
Profile row, so a report found on a CI server months later answers "where did the
logs go" itself.
pytest-html-reporter config prints every
setting a run here would resolve, which layer decided it and which layers it overrode — running
nothing. --report-show-config prints the same table in the pytest header of a real run.
xdist worker is shaped by the same profile the controller is, and a suite that names
no profile runs byte for byte the report it ran yesterday.
See Configuration for where profiles are written, what the 27 settings are called, and the six layers in order.
Runs distributed with pytest-xdist are gathered into a single report. Every worker
sends its results back to the controller, which merges them and writes one report — one build in
Archives, one set of totals, one row per test — whichever way the tests were
distributed. Tests are listed in collection order rather than the order the workers happened to
finish them in, so a parallel report reads the same as a serial one. Nothing needs configuring,
and running without -n is unaffected.
$ pytest tests/ -n 2 --html-report=./report
$ pytest tests/ -n auto --dist loadfile --html-report=./report
The strftime placeholders in --html-report are expanded once, when the
run starts, which is what lets a parallel run — and a run that crosses a minute boundary — still
write a single report.
The plugin reacts to pytest-rerunfailures; there is no rerun-specific flag to set. A
retried test is one row carrying the outcome that stuck, with the attempts it took in the
Rerun column.
kept. A test
that failed twice and then passed used to read PASS 2 with nothing anywhere in the
report saying what it had failed with; two failures for two different reasons is a different bug report
from the same failure twice. The panel's Copy button hands the trail over in the shape
somebody pastes into an issue. See the attempt
trail.Two more behaviours are worth knowing, and they deliberately differ:
Analytics counts retries too: a test that needed one to pass is flaky by definition, and the per-test row carries a retries column.
pytest-xdist merges within one run, so a CI matrix — several processes on several
machines — is out of its reach. Name each leg with --report-shard instead: it writes a
bundle to <report>/shards/<id> and no report of its own, and the standalone
pytest-html-reporter merge command turns every bundle into one build once the legs have
finished. Legs that run one after another on a single machine can skip the extra command — give the
last one --report-shard-merge and it merges as it ends.
Each leg still needs its own artifact name to get its bundle off the runner. The
GitHub Action takes an artifact-name input for exactly
this, and a build-info entry is the place to record which leg of the matrix a record
came from. The CLI reference has the four shard flags and the merge
command's own options.
CI integrations covers the rest: keeping the archive folder between runs so the trend charts have something to draw, and publishing the report where people will actually open it.
A composite action that installs the plugin, runs pytest and publishes what comes out. Its
inputs mirror the plugin's flags one for one — report-path, title,
environment, build-info, archive-days,
report-logs, report-coverage and the rest — plus the parts that only make
sense on a runner.
name: tests

on: [push, pull_request]

jobs:
  test:
    runs-on: ubuntu-latest
    steps:
      - uses: actions/checkout@v4

      - uses: prashanth-sams/pytest-html-reporter-action@v1
        with:
          python-version: '3.12'
          requirements: requirements.txt
          tests: tests/
title: Nightly regressionfailure-limit, the suites ranked by damage, the slowest tests, and coverage when the
run measured any — without clicking through to an artifact.
history: 'true' carries the
archive/ folder between runs with the Actions cache, so Trends, Archives and
Analytics have more than one build to show on a fresh runner.
min-pass-rate and min-coverage fail the
job on a threshold, fail-on-empty catches a mistyped -k that would
otherwise go green, and around twenty outputs — passed, failed,
pass-rate, coverage, status — let a later step post to
Slack, open an issue or gate a deploy.
The GitHub Action in full — every input, the recipes for a pull-request comment, a coverage gate and a Pages deploy, and the outputs a later step can read.
The same results in the sidebar, while you are still in the file that broke. It reads
output.json rather than the generated HTML, finds the report on its own, and reloads
when a run finishes.
def. Copying gives you the original error, terminal colouring intact.
archive/ are read to tell a test that
sometimes fails from one that has never passed. Stable tests get no badge, so the ones
that do mean something.
The VS Code extension in full — where it looks for your report, what each setting does, and the layout it expects on disk.